NewsArterial is now backed by Techstars!
Learn moreA living inventory of your city’s roads.
Every roadway asset and hazard in your jurisdiction, inspected every day by the vehicles already driving the network.
Great teams can’t act on what they can’t see.
Most cities have no real data on the condition of their roads and supporting infrastructure. Many do not know where their signs or guardrails are, and only discover problems like potholes after someone complains.
The only current paths to visibility
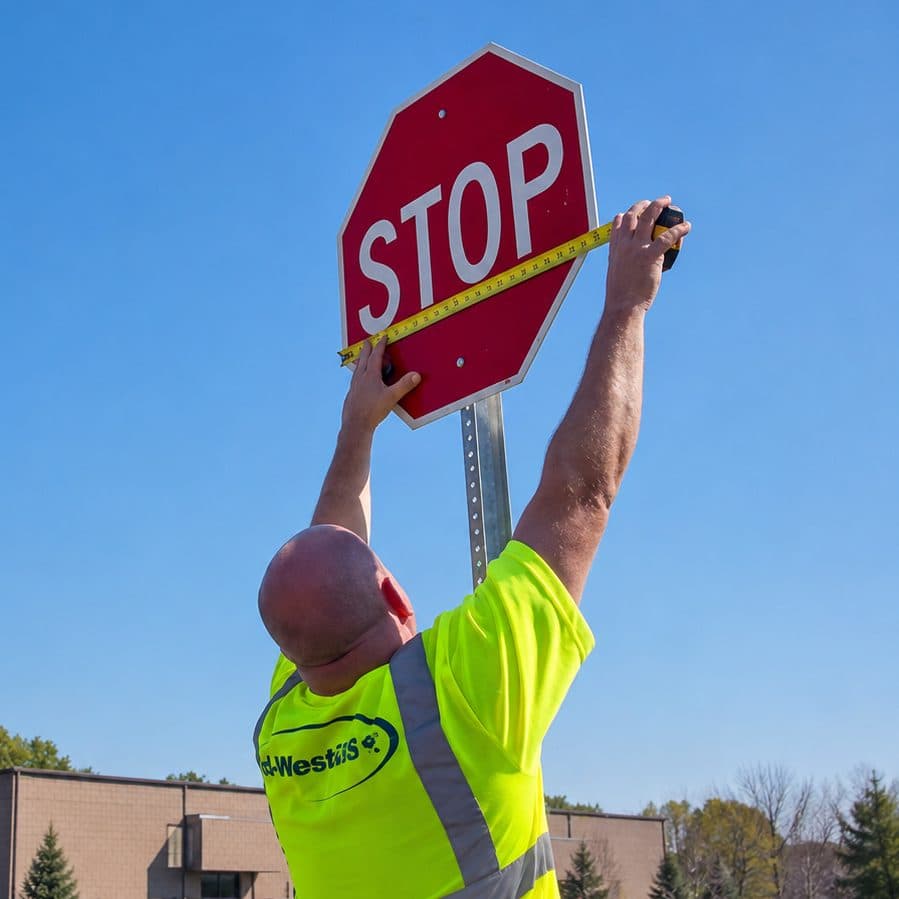

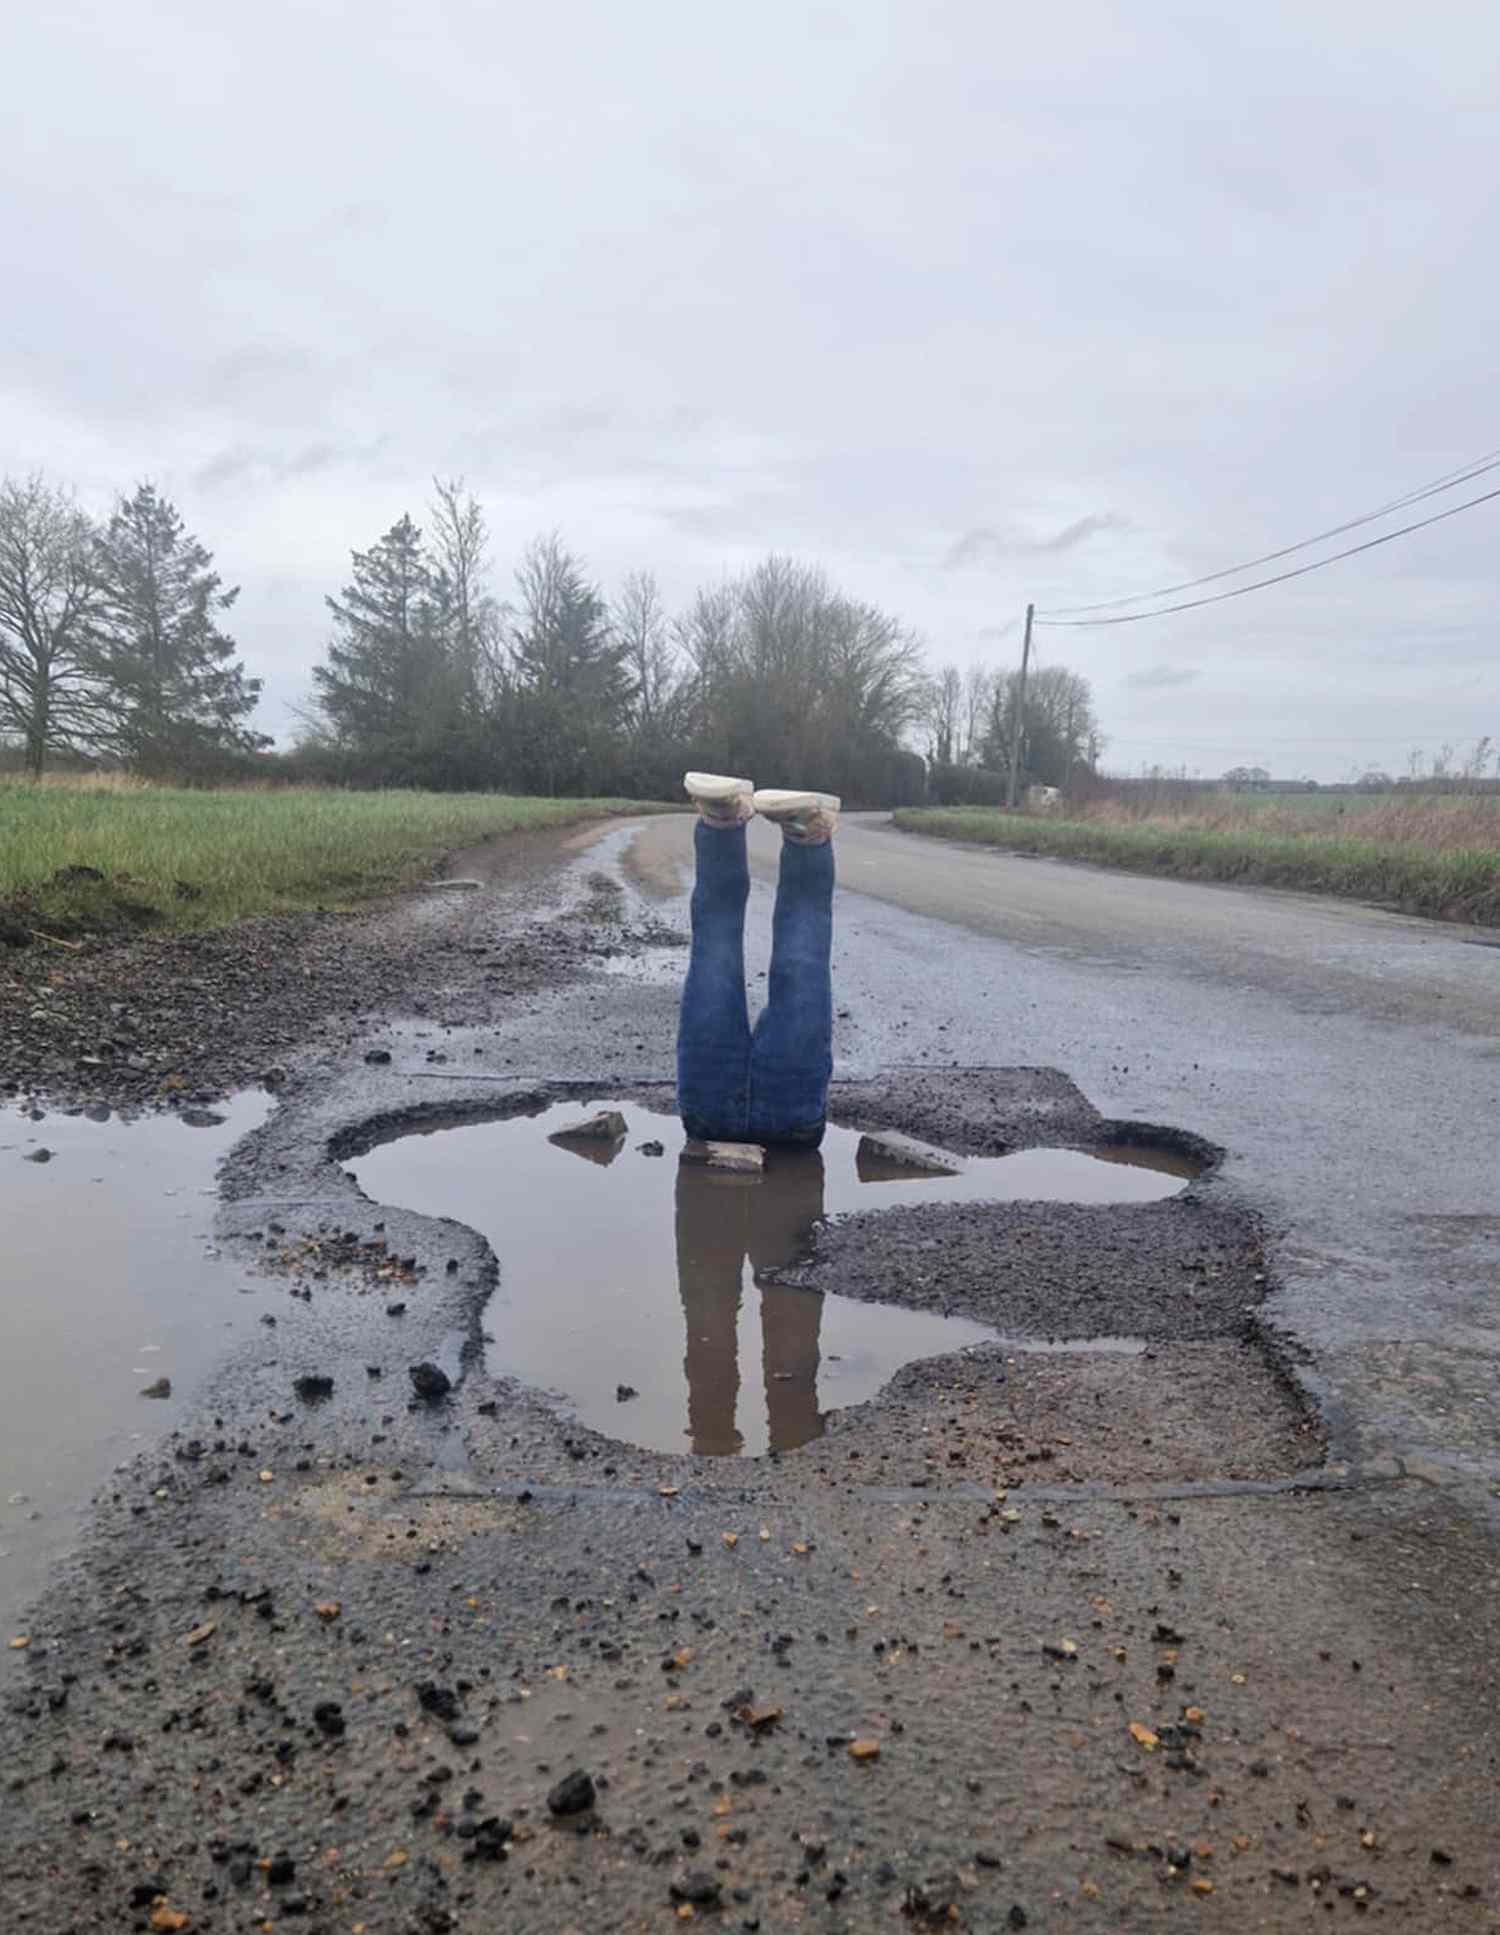
Doesn’t know how many signs they have or where they are.
Months to collect. Millions to maintain.
Arterial makes it a click.
- 01Equip the Fleet
- 02Collect While You Drive
- 03Build an Inventory
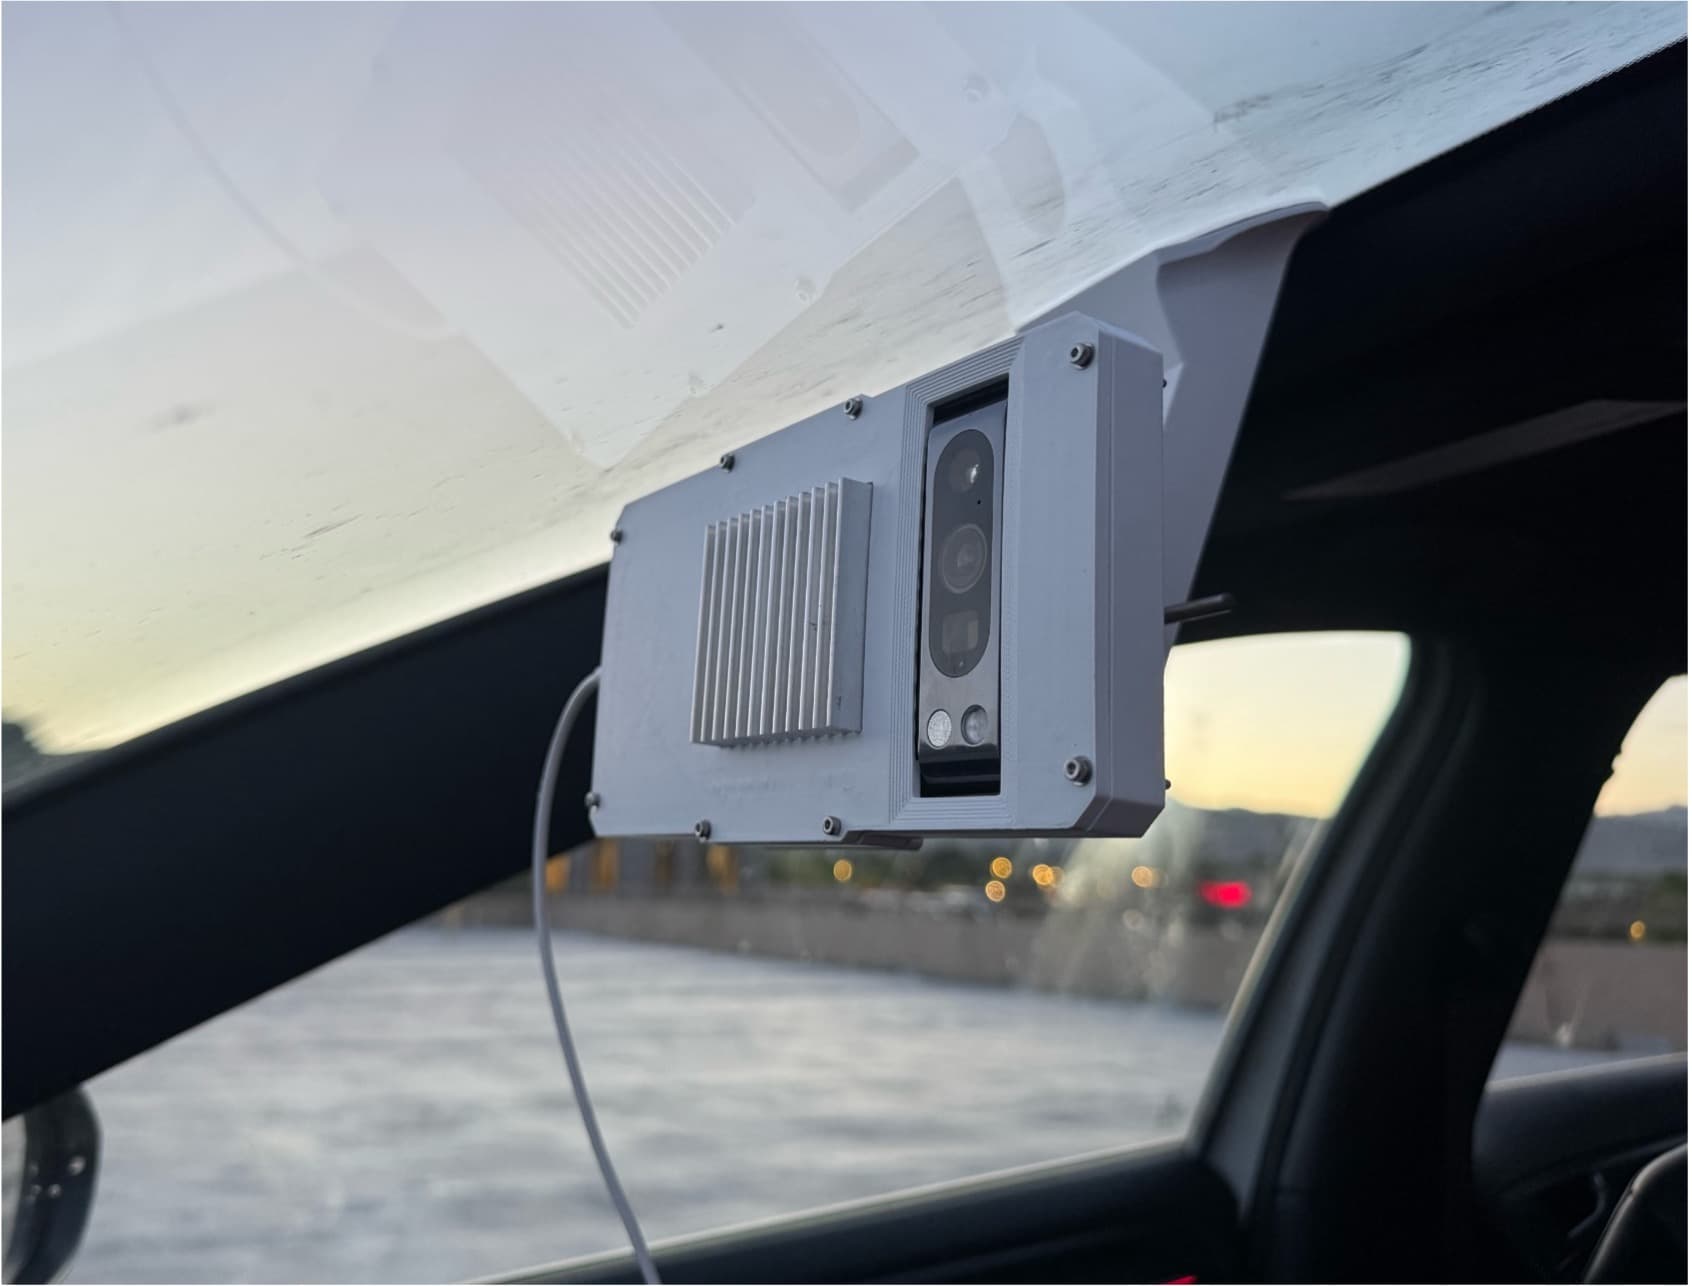
Equip the Fleet
ARTIE™ units mount into your fleet vehicles — trash trucks, street sweepers, anything already on the road — in under two minutes.
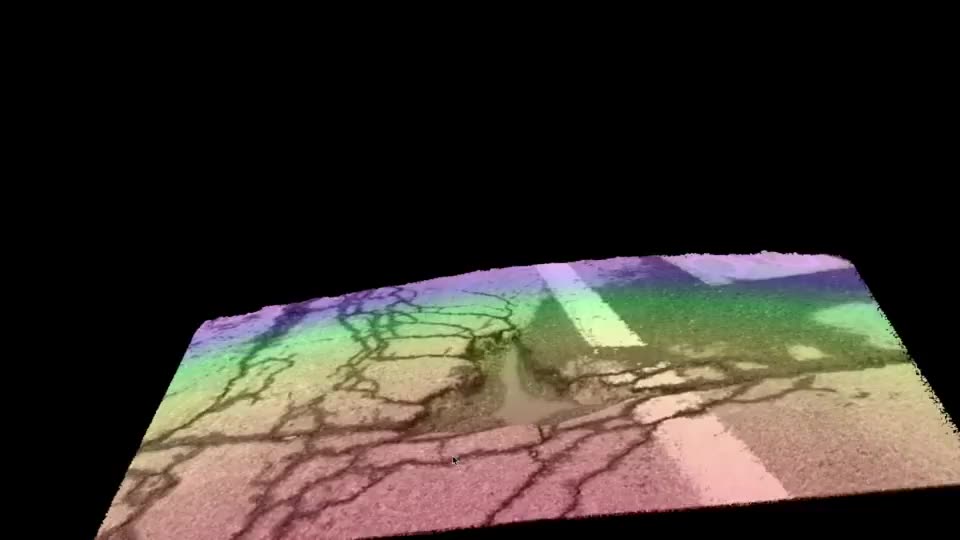
Collect While You Drive
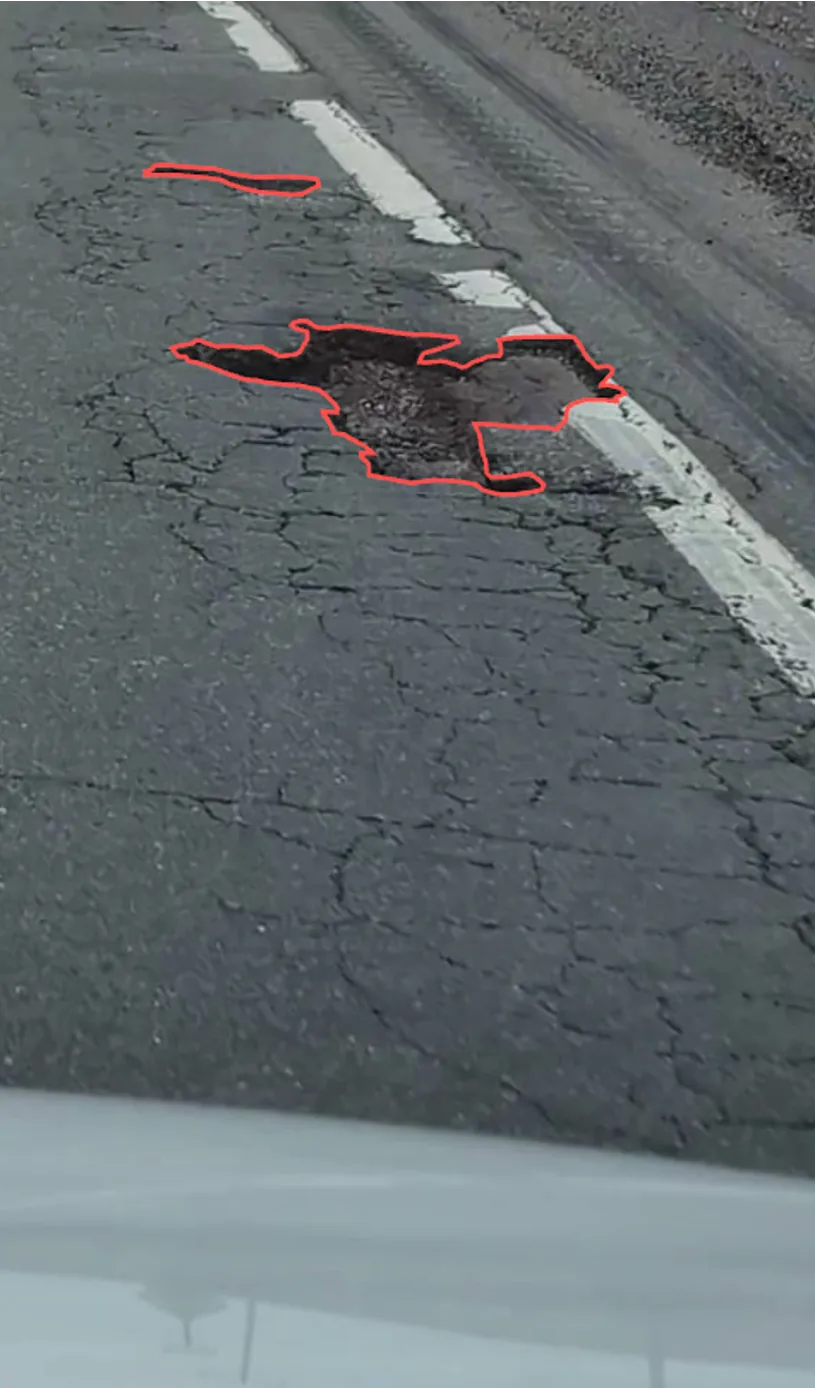
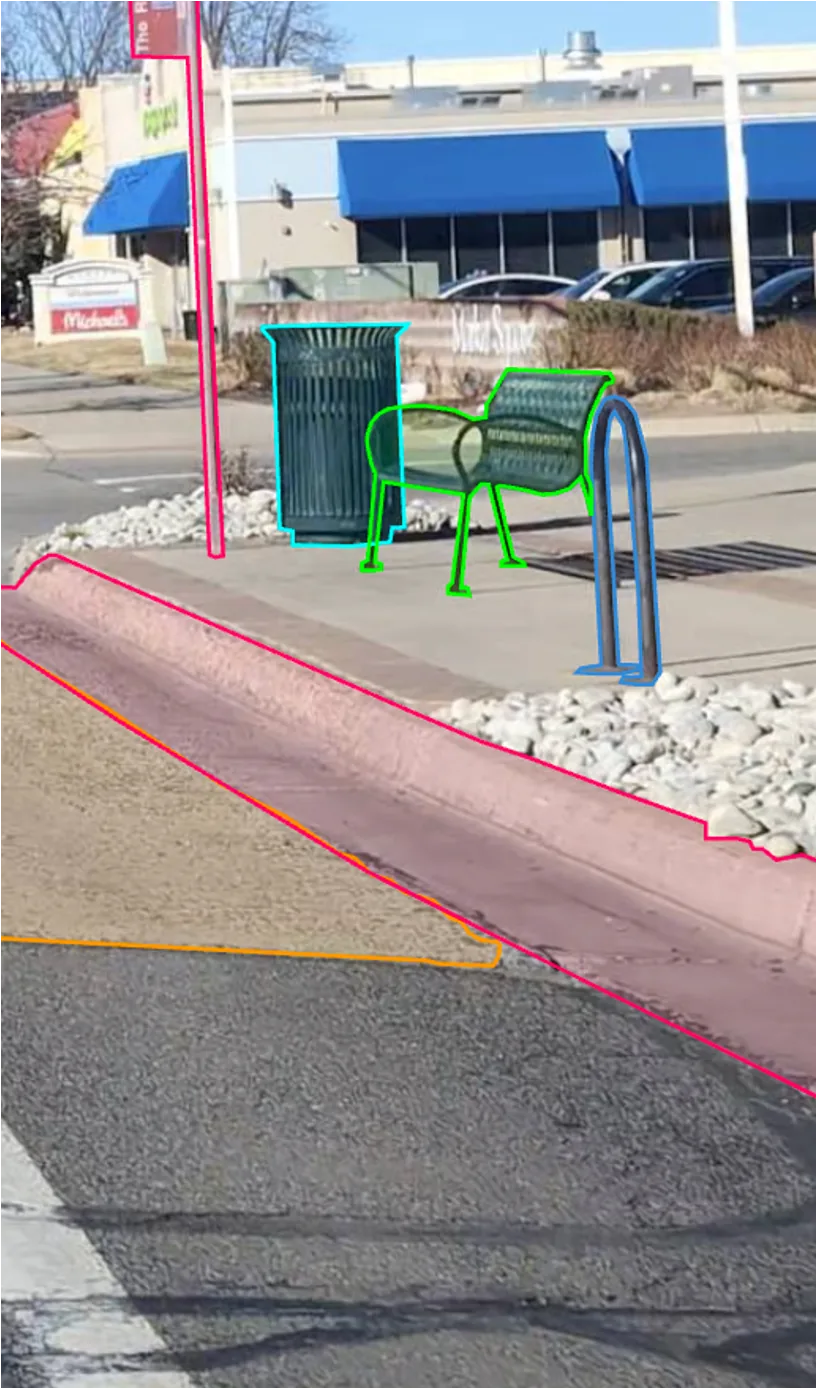
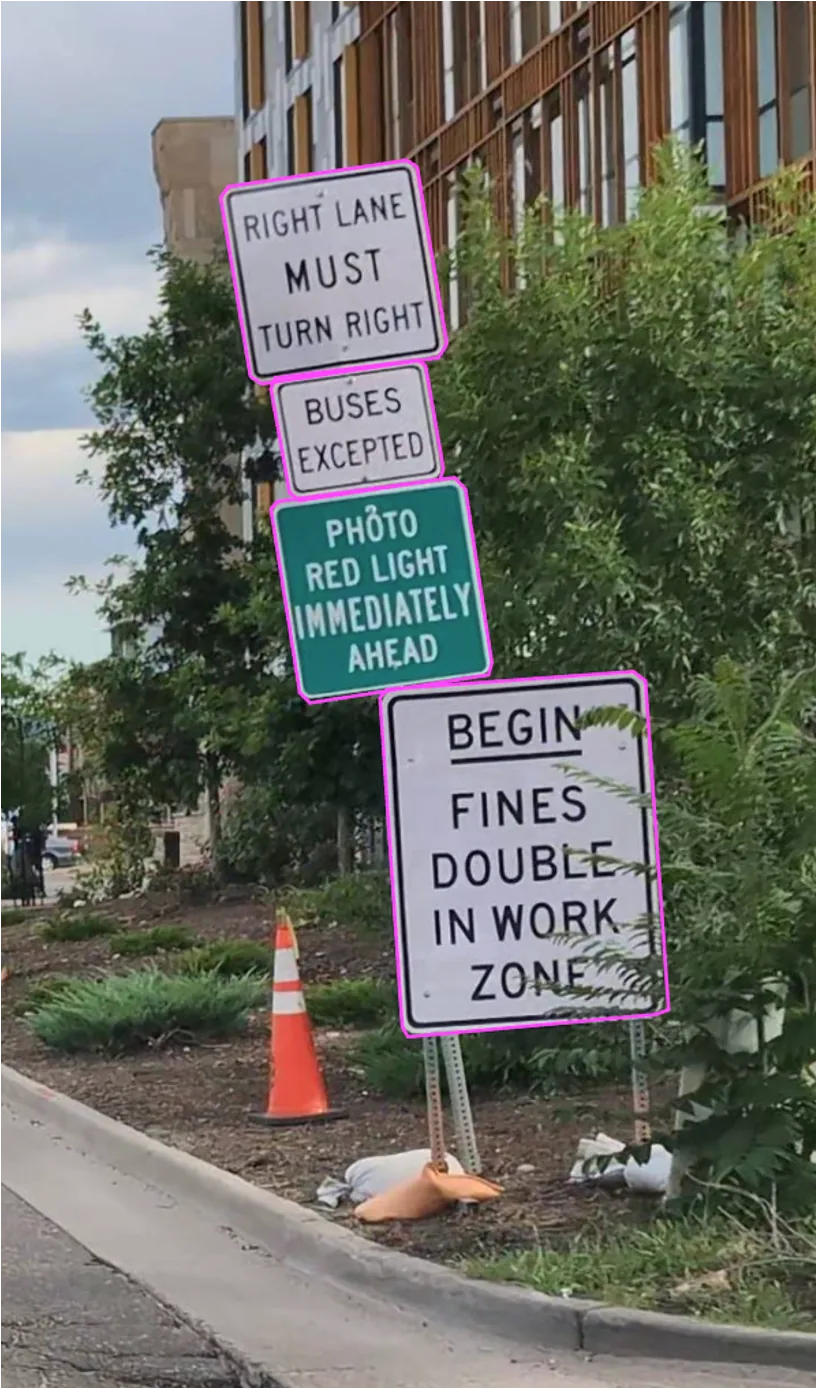
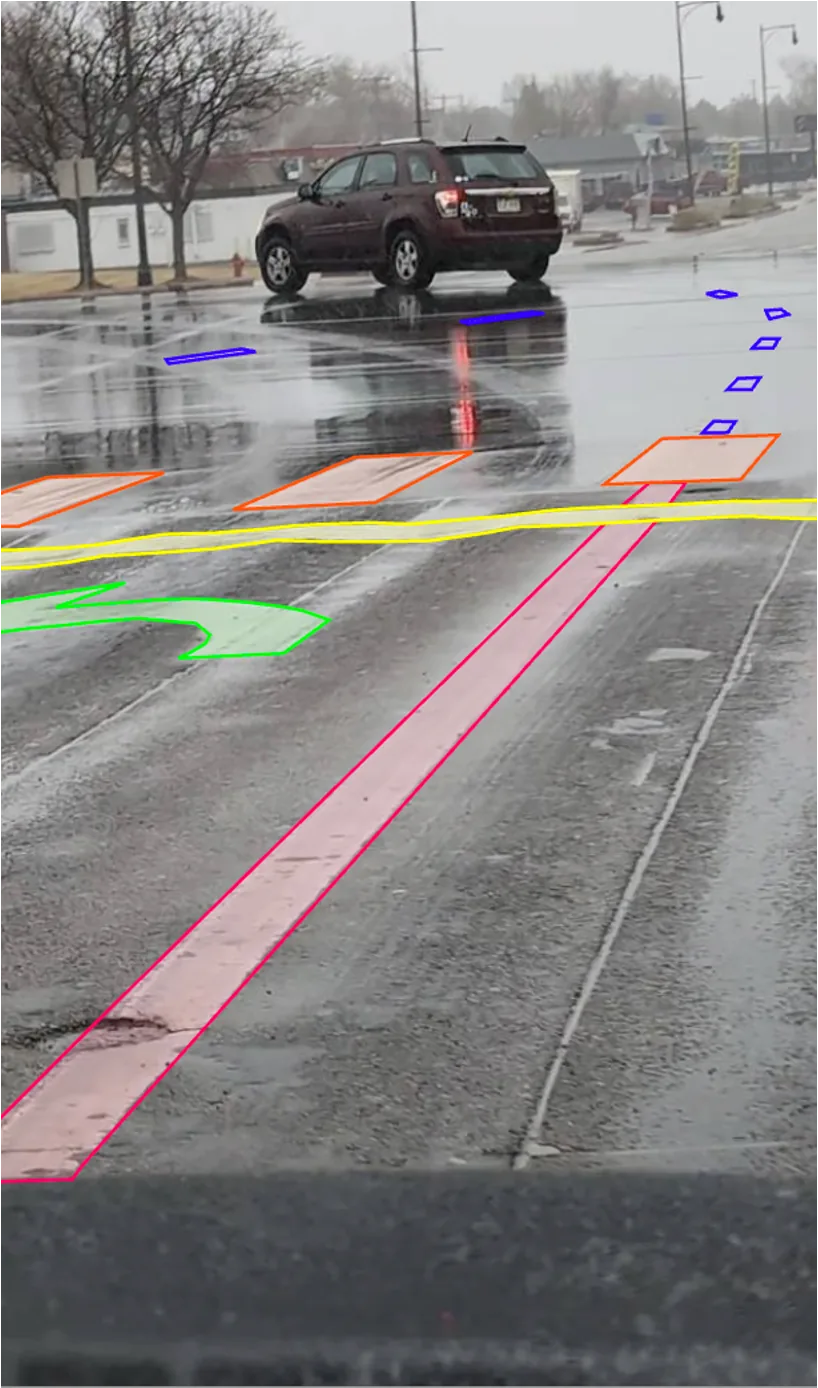
Crews drive their normal routes, and the AI automatically picks up information on the roads they travel.
Build an Inventory
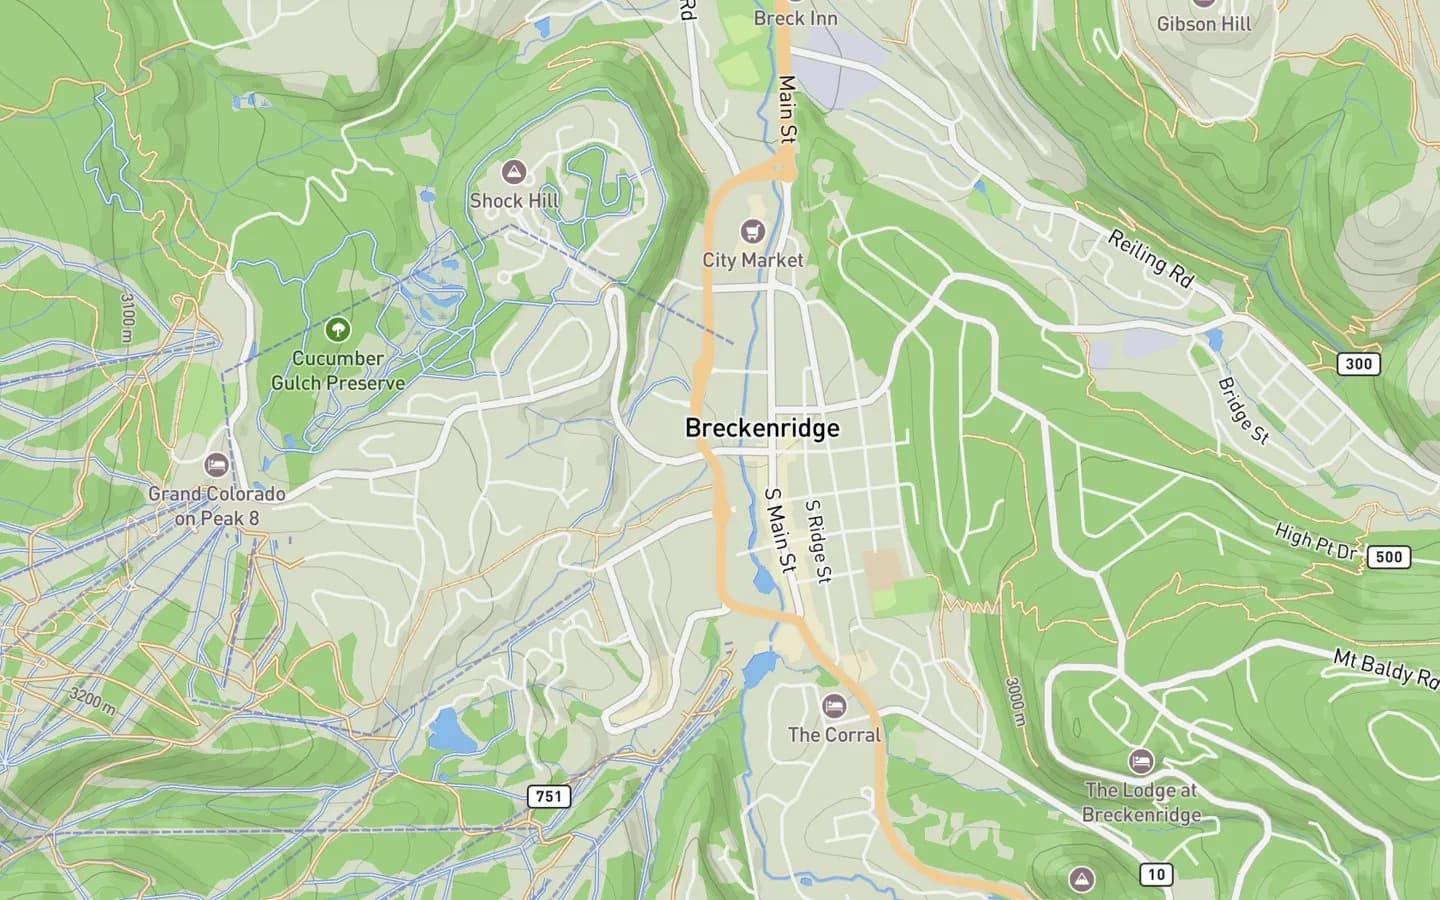
Detections are enriched and added into a massive living GIS inventory of your right-of-way, updated to reflect the world as it currently exists.

From visibility to action.
Understand your network, detect change, set priorities, and deploy crews where they can make the greatest impact.
 01
01Where everything is
Build new inventories, update existing ones, and see your jurisdiction as it exists today.
 02
02What condition it's in
Know sooner. Act earlier. Solve problems before they become complaints.
 03
03What to fix first
Make decisions based on what will have the greatest impact across the network.
 04
04How best to fix it
The fastest route, the right repair, and what to bring with you.
The features that do the work
From what gets collected to what your crews do with it.
Right-of-way filtering
Exclude anything outside your right-of-way.
Prioritization
Prioritize fixes around your goals.
- Set your own goals
- Reorders instantly
- No generic severity score
Decision Tree
Find the optimal approach to remediation.
- Your criteria
- Your materials
- Your standards
Route Optimization
Reach more issues in less time.
Data Ownership
Your data stays yours.
Everyone maps the problems.
We tell you the solution.
Two failures kept this market from working. They are the two things we built Arterial around.
Fidelity and Refresh
Most vendors provide only an image, issue type, and location. Survey-grade alternatives are too costly to repeat more than every three to five years. Arterial delivers survey-grade fidelity, continuously refreshed, without forcing you to choose between finding potholes and filling them.
Actionability
A map of every problem will not help you solve more of them. Agencies already struggle to keep pace with what crews and residents surface. Arterial goes beyond inventory — weighing the importance, urgency, and risk of every issue to turn everything you could fix into what gets fixed tomorrow.
What that means in practice
Competitors vs. ArterialA snapshot every six months to three years.
80% of the network, every two weeks, passively.
Image, type, location.
Size metrics, condition, context, risk, and more.
Dedicated city staff to filter the data.
97%+ detection accuracy, right-of-way filtered, reviewed before delivery.
Every problem you could theoretically solve.
What should get fixed first — by your own metrics.
We do not make a map of every pothole in your jurisdiction so we can sell you the map. We do it so when we tell you that these three are the most dangerous, we know for a fact that we are right.
Community reports are free.
We must be better than free.
of a jurisdiction covered every two weeks
detection accuracy
depth projection accuracy
passive collection, no intentional surveying
We know which signs you’re missing.
Do you?
See the system in action and explore what it could do for your jurisdiction. Our demos are always informative, never sales.
Public works · DOTs · Right-of-way agencies