01Capture
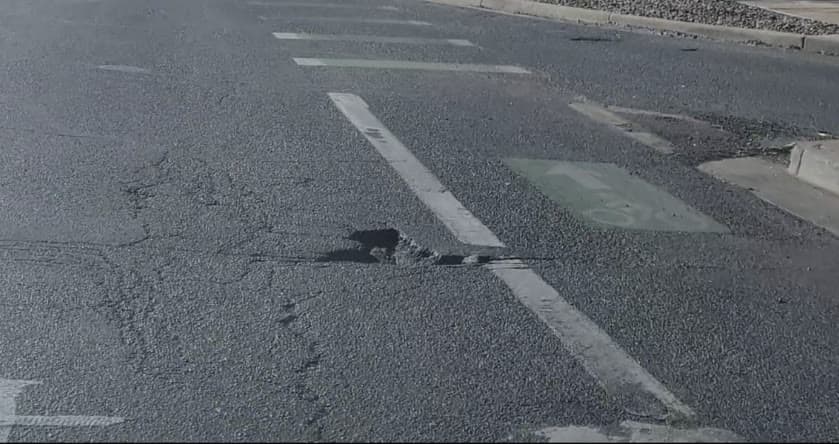
Ordinary footage from a drive the crew was already making.
Data is, ultimately, our product. See how we collect it, enrich it, and turn it into an actionable view of your roads.
| ID | Image | Type | Status | Coordinates | L (cm) | W (cm) | D (cm) | Deg. Rate (cm³/wk) | Spd Limit | AADT | Wheel Path | Bike Lane | Intersect. | Snowplow | Civ Rep. | |
|---|---|---|---|---|---|---|---|---|---|---|---|---|---|---|---|---|
| PTH-00412 | 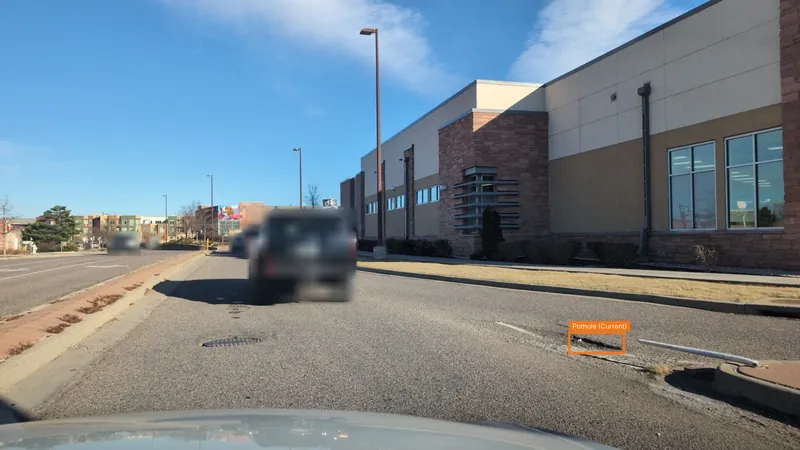 | Pothole | Unfiled | 39.7392° N, 104.9903° W | 71.1 | 48.3 | 10.7 | 184.2 | 65 mph | 48,200 | 3 | |||||
| PTH-00389 | 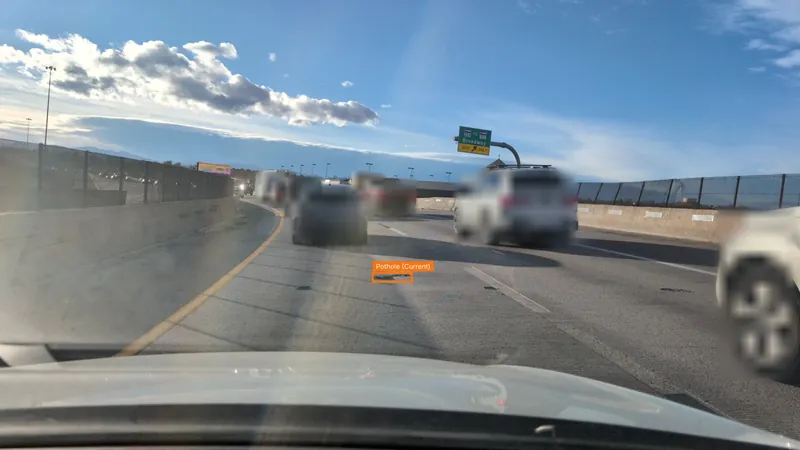 | Pothole | Unfiled | 39.7484° N, 104.9871° W | 55.9 | 35.6 | 9.7 | 156.8 | 65 mph | 51,400 | 1 | |||||
| PTH-00401 | 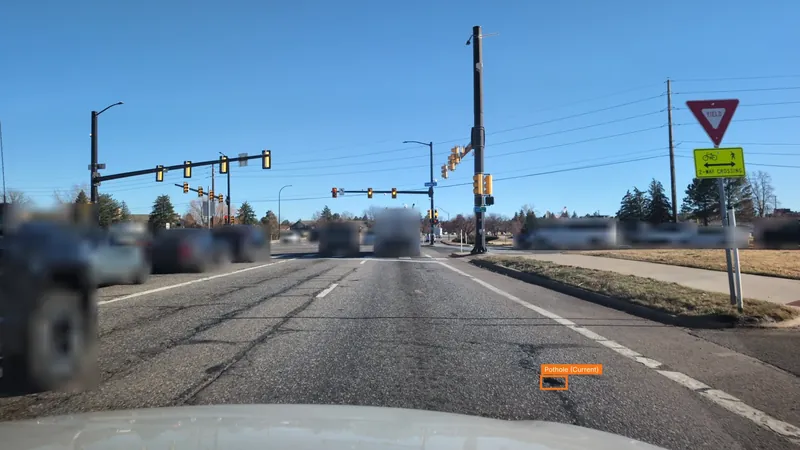 | Pothole | Scheduled | 39.7318° N, 104.9956° W | 45.7 | 30.5 | 7.4 | 112.4 | 45 mph | 22,800 | 2 | |||||
| PTH-00374 | 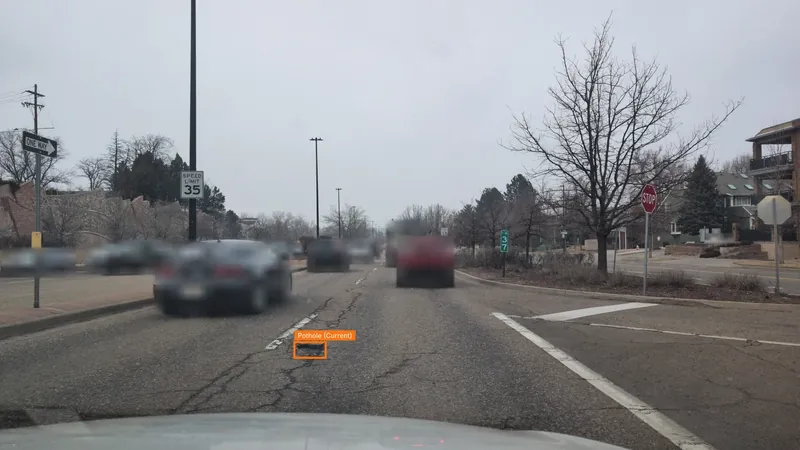 | Pothole | Scheduled | 39.7205° N, 105.0014° W | 35.6 | 22.9 | 5.3 | 88.6 | 35 mph | 14,600 | 4 | |||||
| PTH-00398 | 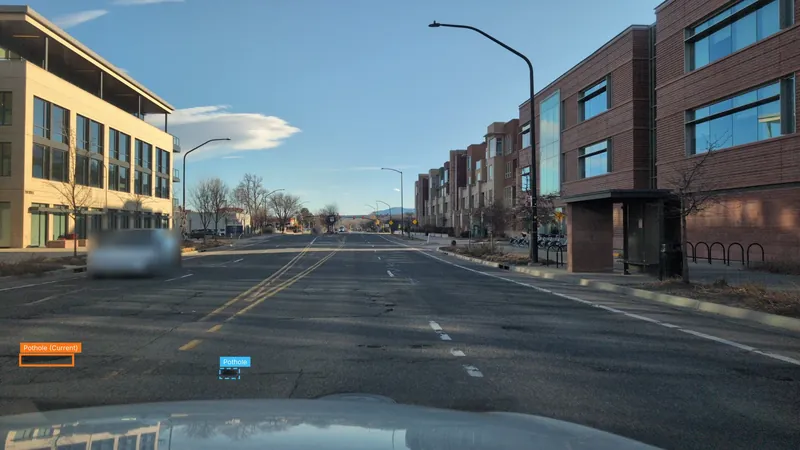 | Pothole | Unfiled | 39.7441° N, 104.9832° W | 40.6 | 27.9 | 6.1 | 74.3 | 30 mph | 9,400 | 1 | |||||
| PTH-00355 | 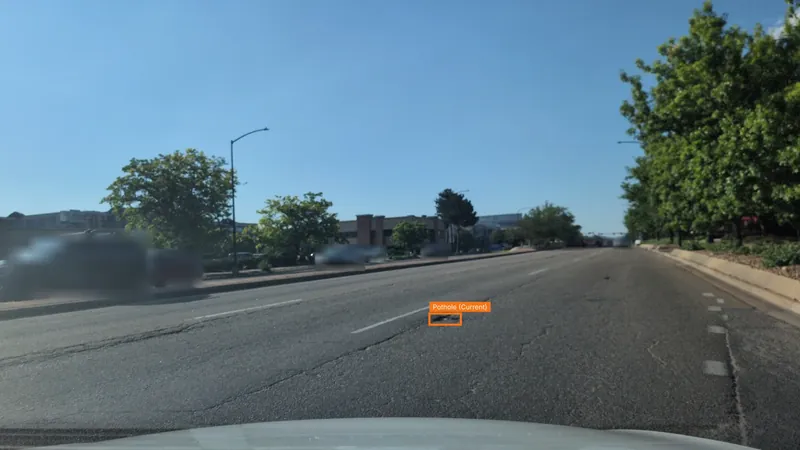 | Pothole | Unfiled | 39.7156° N, 105.0088° W | 30.5 | 20.3 | 4.3 | 49.1 | 40 mph | 18,200 | 0 | |||||
| PTH-00362 | 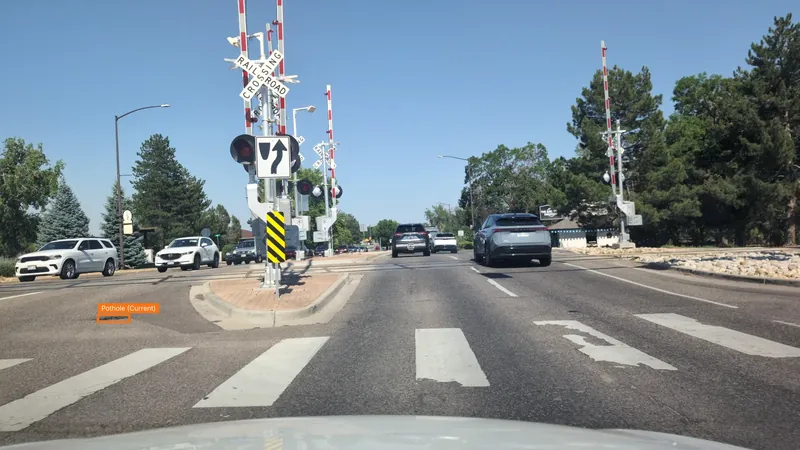 | Pothole | Unfiled | 39.7267° N, 104.9779° W | 25.4 | 17.8 | 3.6 | 31.7 | 35 mph | 11,600 | 0 |
The vehicles already driving your streets become the sensor network — no survey crews, no special trips.
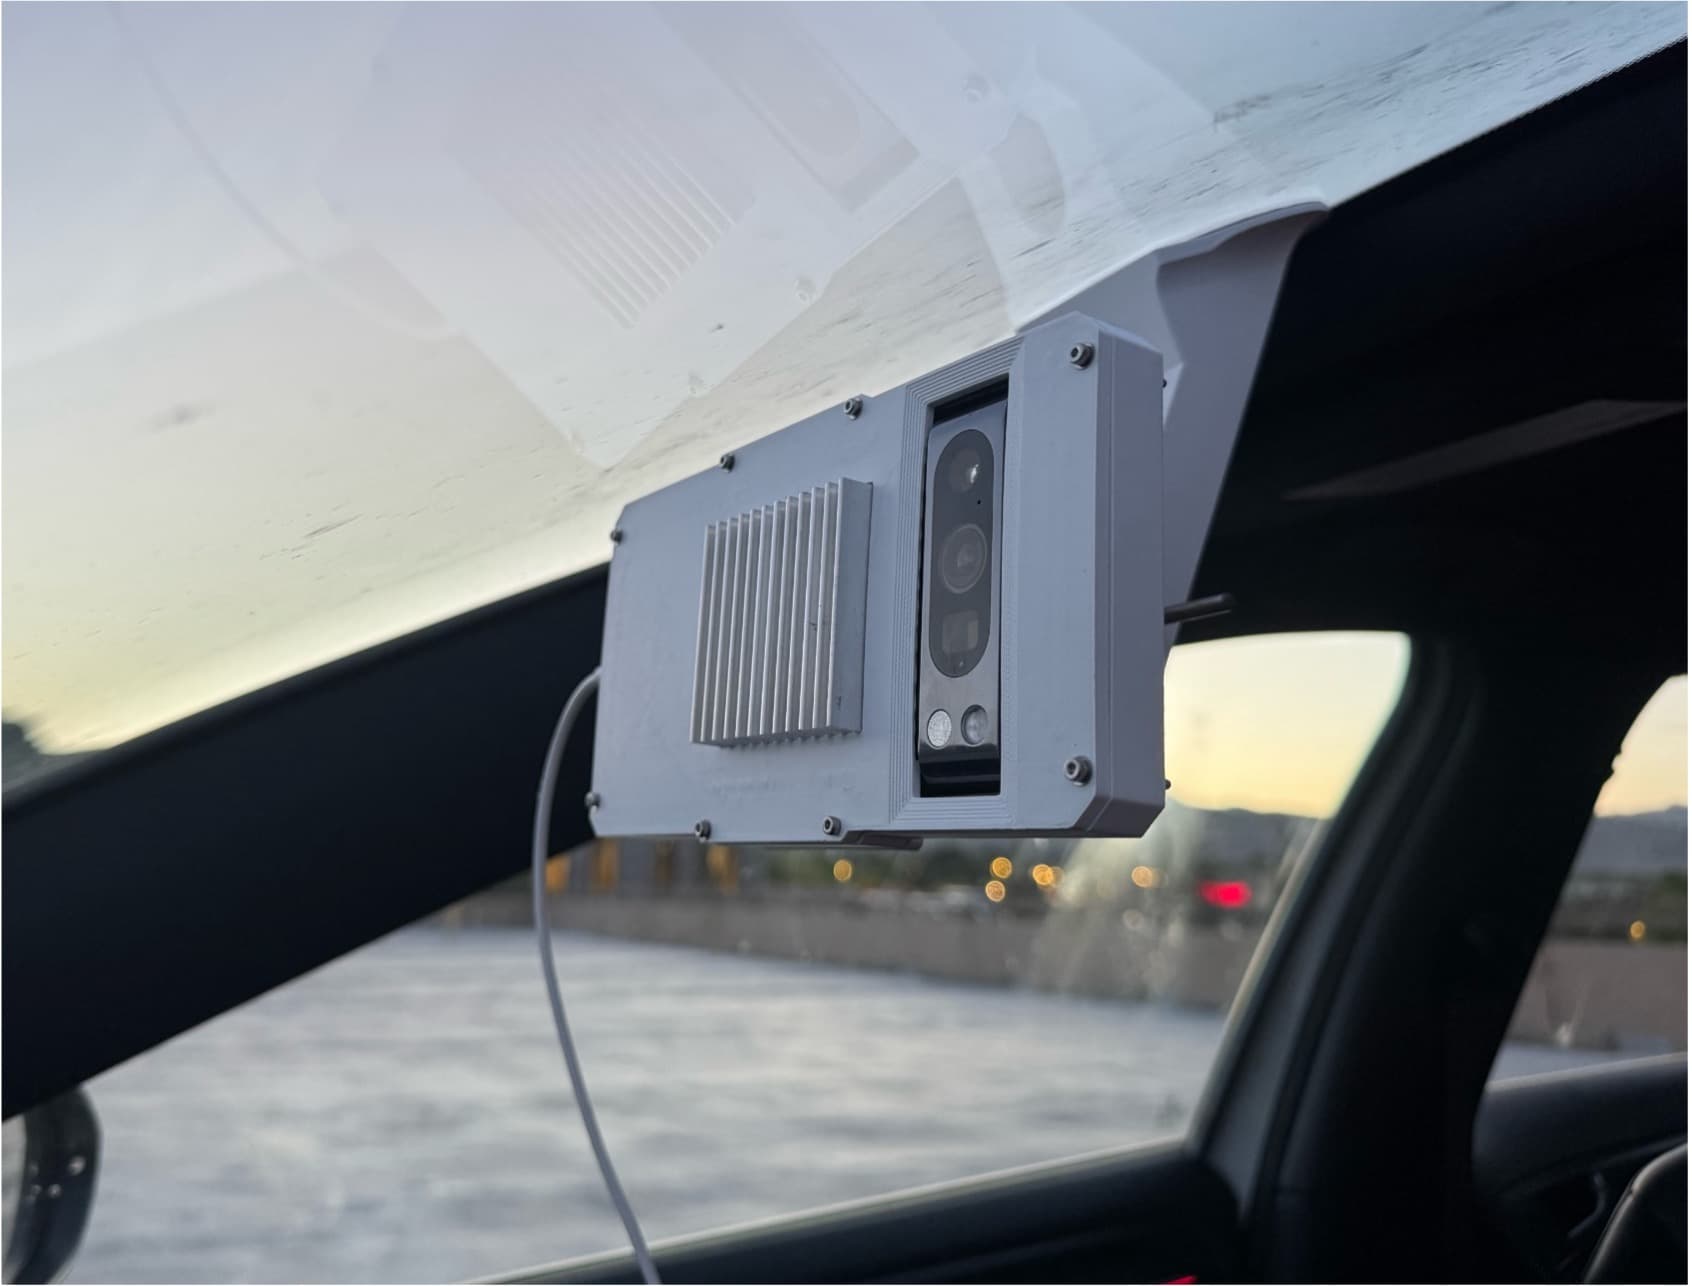
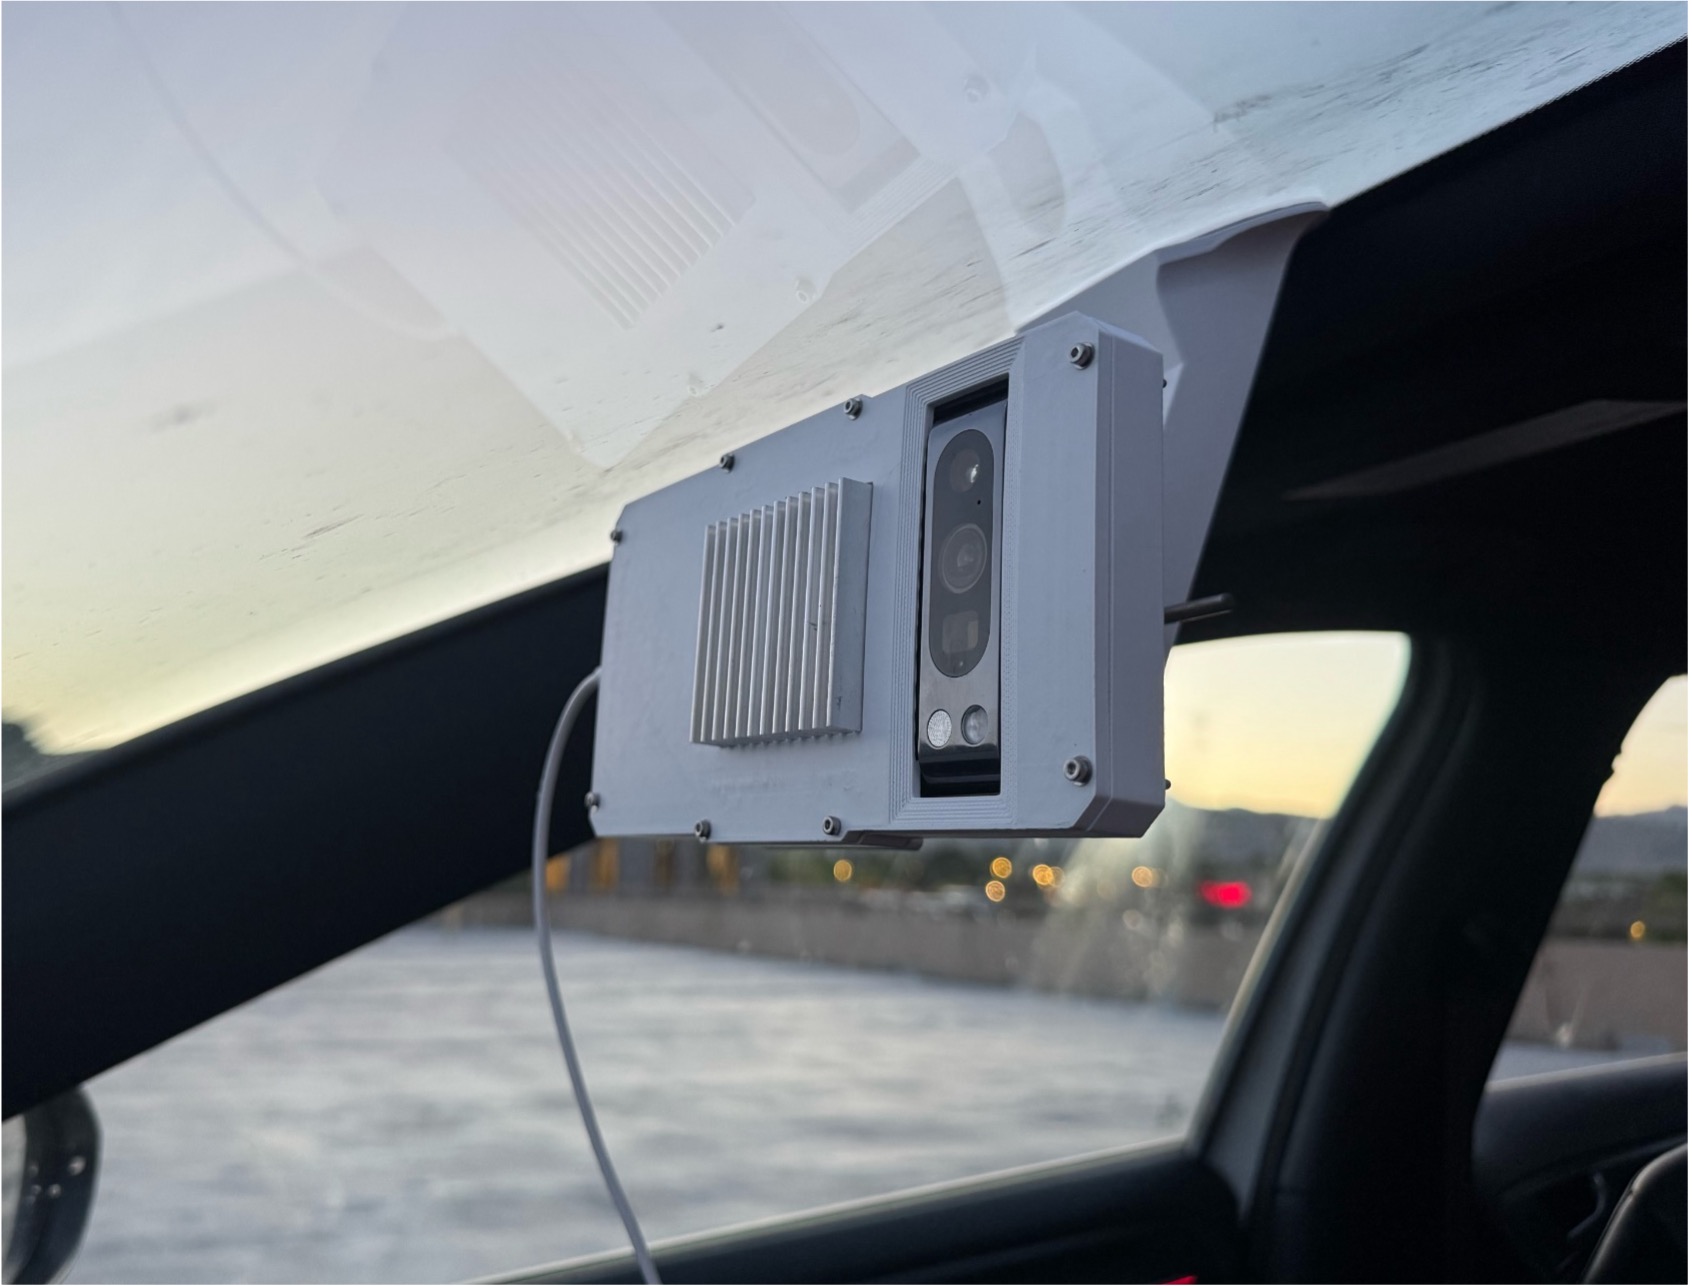
A computer-vision pipeline in a dashcam.
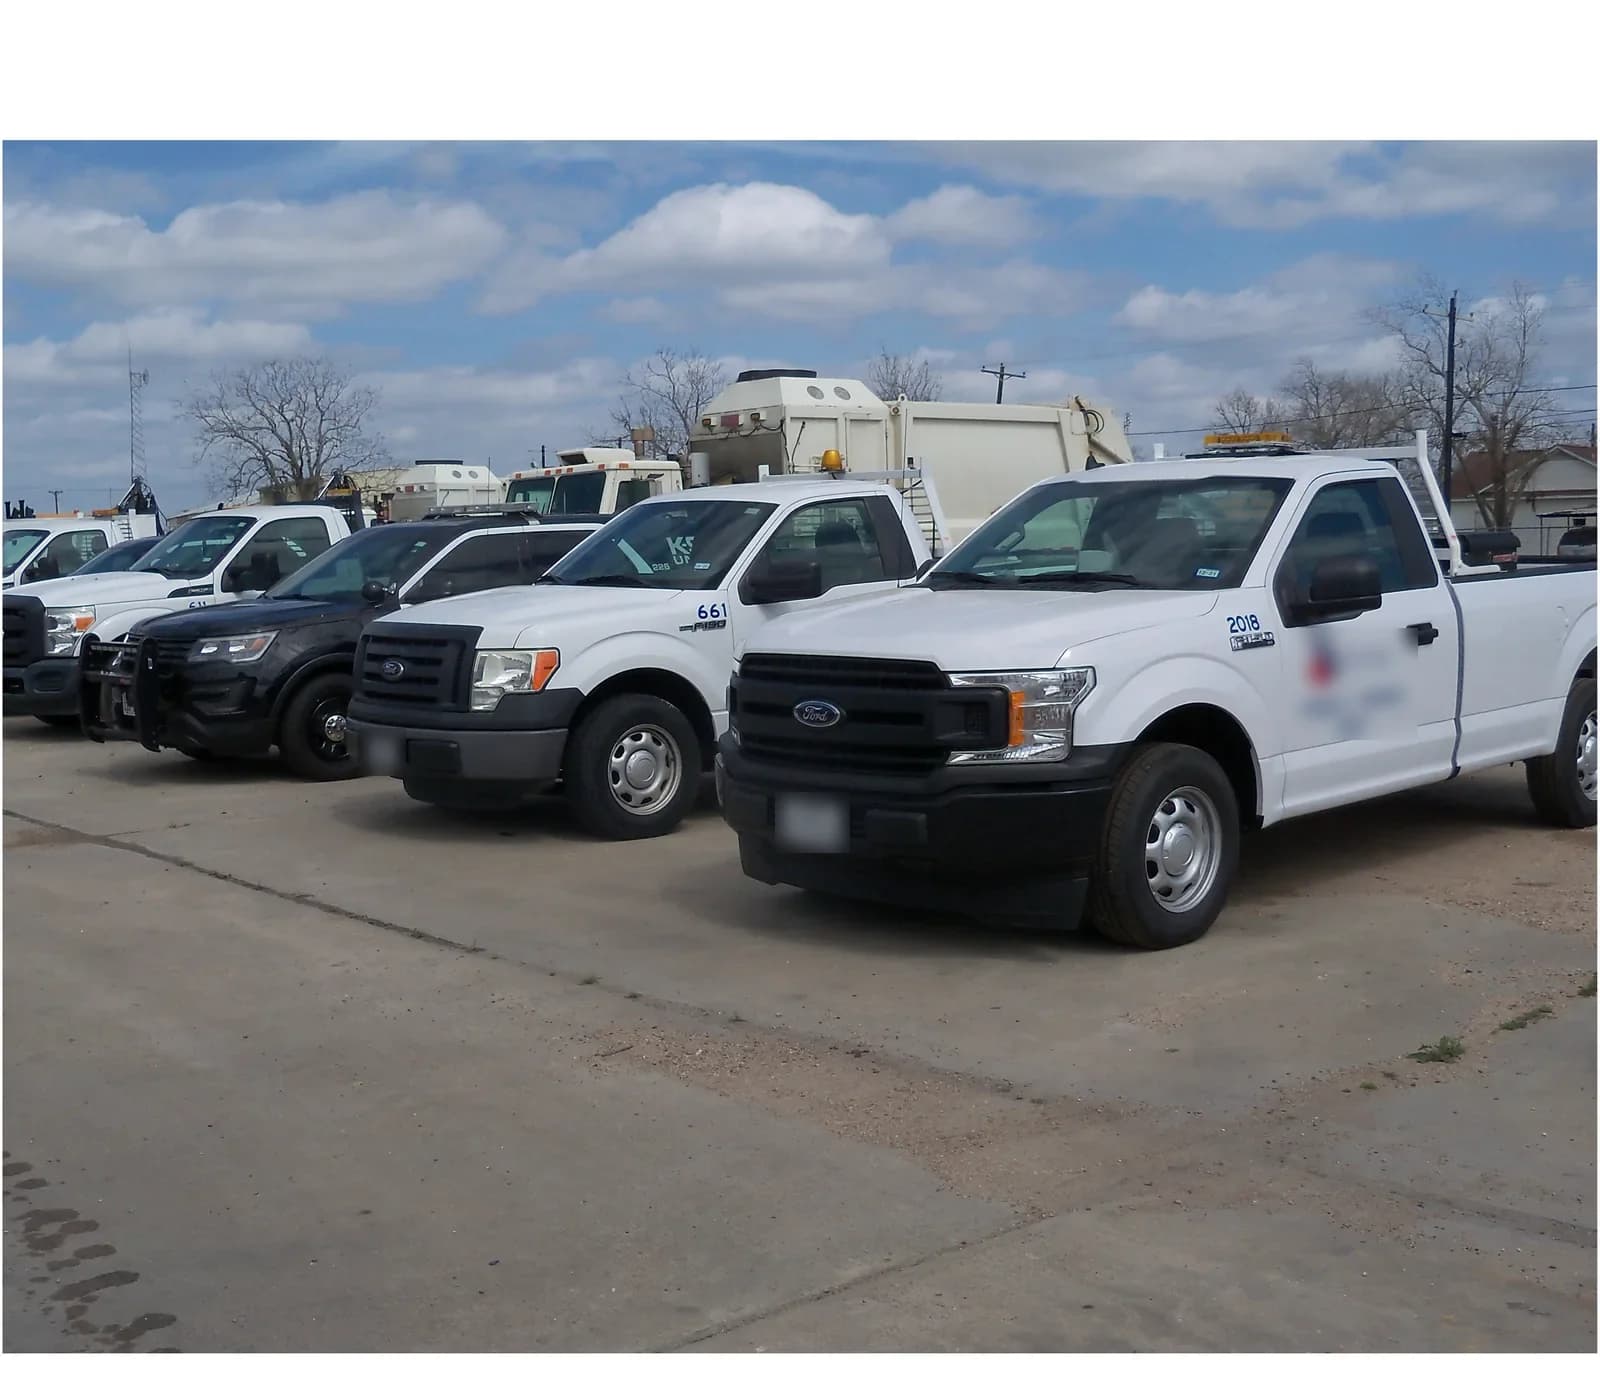
Runs on the vehicles you already drive.
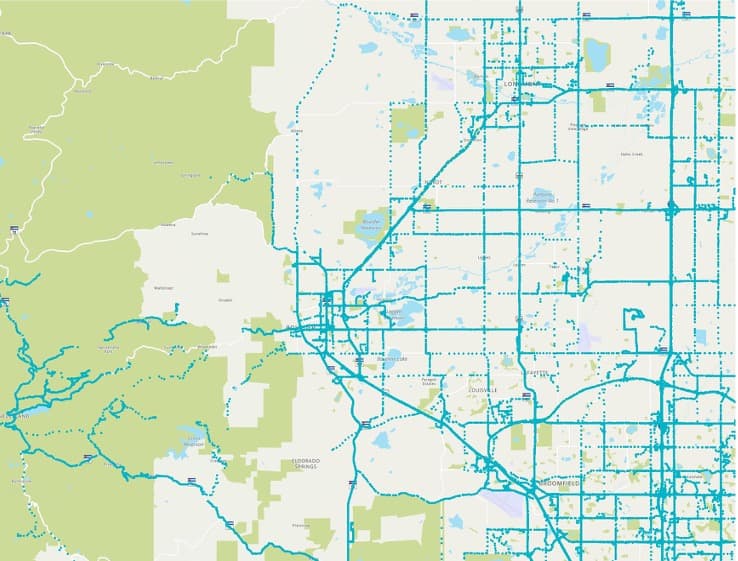
~80% jurisdictional coverage every 2 weeks.
Your crews have a finite number of closures in them each cycle. The queue is sized to match.
Instead of overwhelming your team, Arterial’s Governor™ lets you define clear collection criteria - whether you want to see everything or only what you’re ready to see.
Control the criteria, thresholds, and volume of information you receive.
We enrich our records with dimensions, condition, history, and context, turning a point on a map into intelligence your team can act on.
ARTIE turns every detection into a unique GIS record with imagery and location, updating it each time it is re-detected.
Each object gets physical traits, plus condition attributes specific to that asset.
E-LiDAR gives every detection true physical dimensions — length, width, depth, and volume — from standard camera footage.
Our context engine enriches every detection with the environmental and operational factors that determine how it should be managed.
We evaluate each issue within its unique context to determine its urgency and what should be addressed first based on your agency’s priorities.
Increase the weight of wide, deep potholes within bike lanes and along high-traffic cycling corridors.
Add, remove, or reweight factors at any time, so as your priorities or leadership changes, your data can change with it.
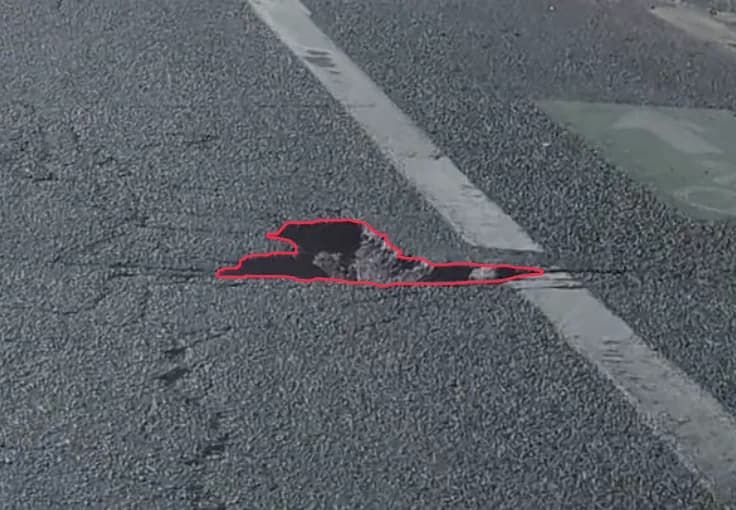
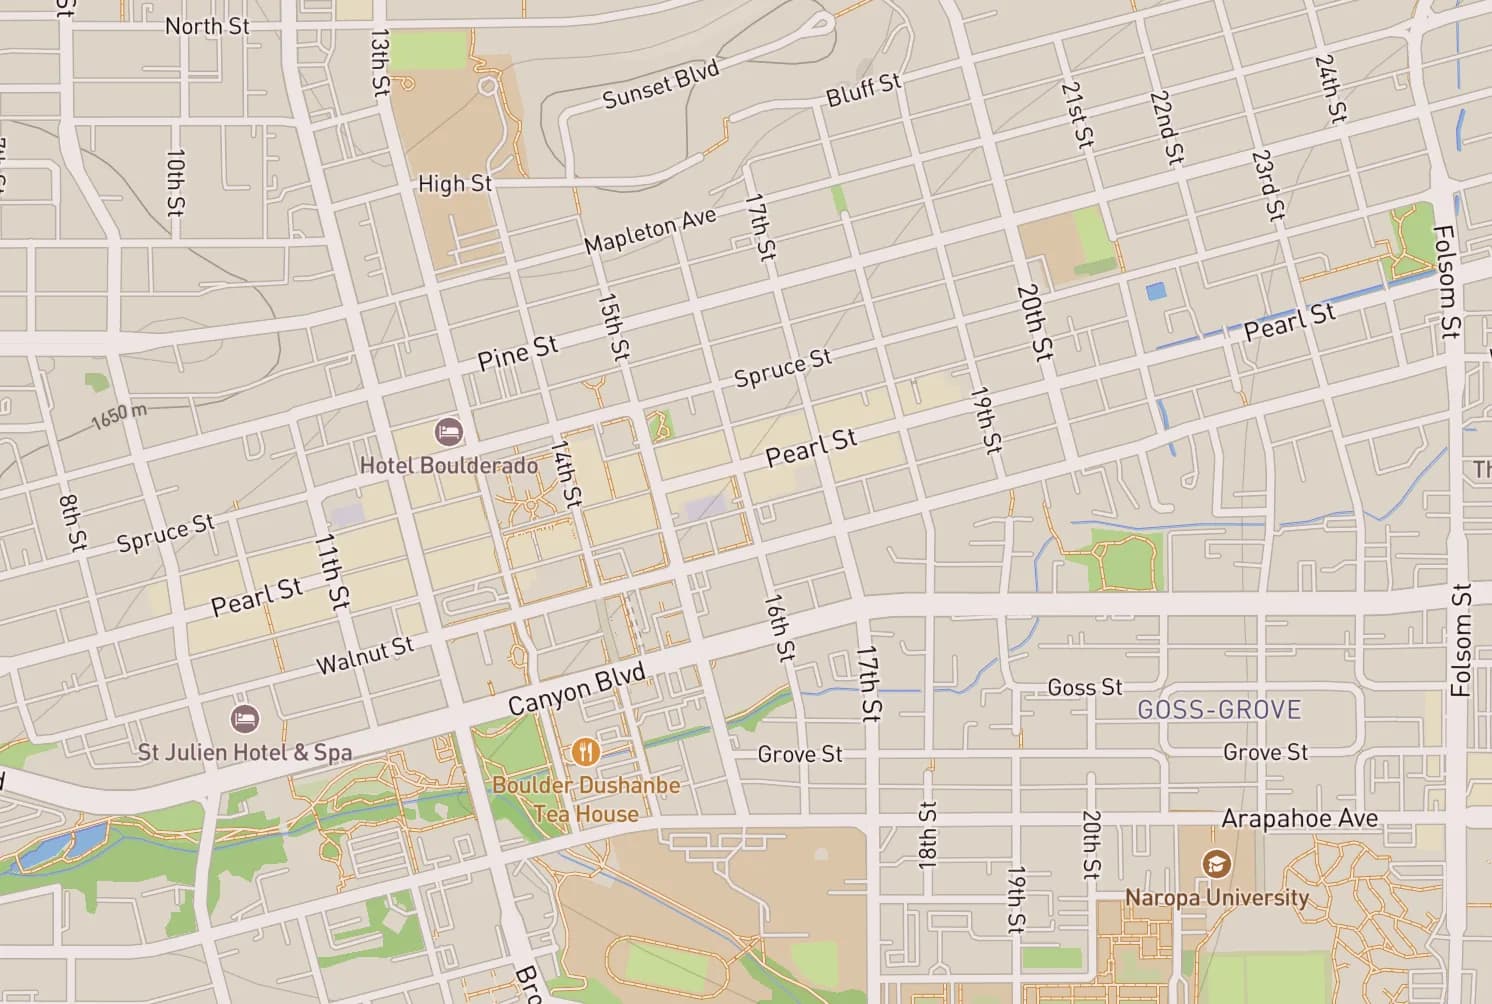
Each detection, once enriched and scored, is added to the living inventory of your jurisdiction.
Our proprietary E-LiDAR engine turns standard camera footage into near-LiDAR-accurate 3D meshes, with sub-centimetre depth measurements taken at road speed. No survey van, refinement period, or massive data storage.
Ordinary footage from a drive the crew was already making.
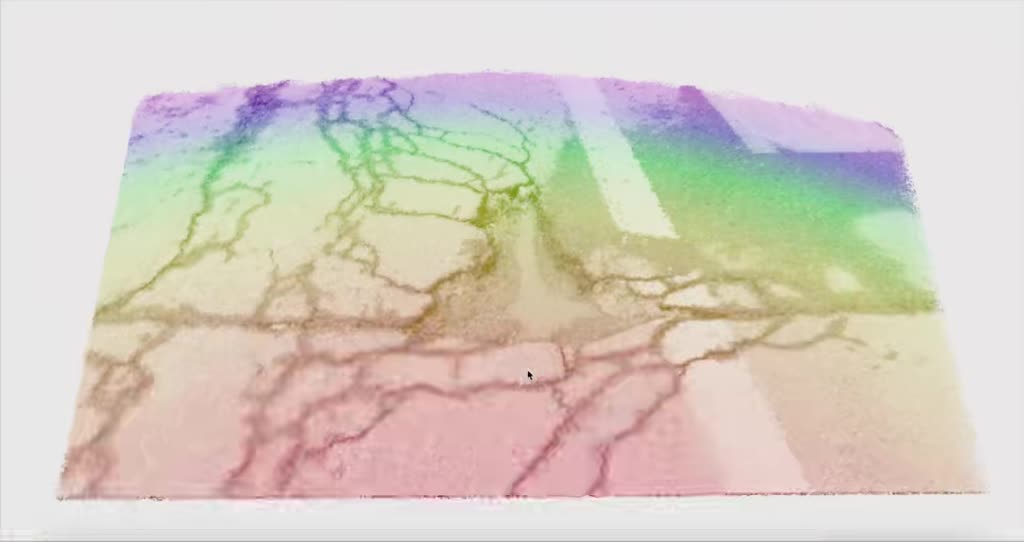
E-LiDAR resolves that footage into a measurable 3D surface.
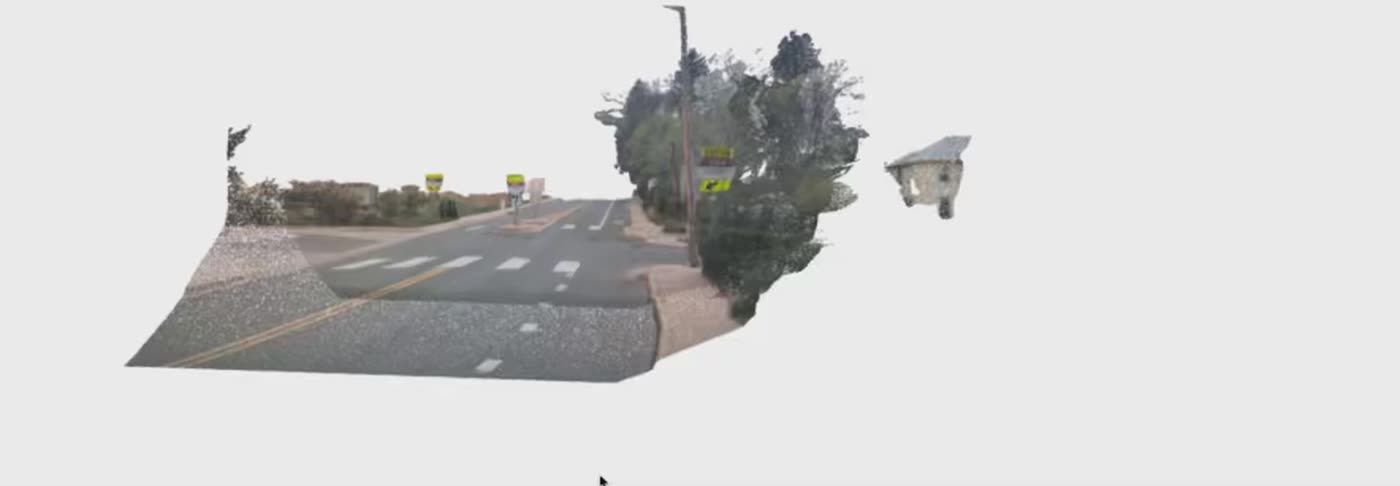
Every pass adds to one continuously refined 3D model of the corridor.
Every record is validated, cleaned, filtered to your jurisdiction, and collected only when you want it.
Every detection is reviewed before it reaches you.
You receive data on only what you own and are responsible for.
Nothing is recorded unless conditions support a reliable read.
Records change only when the update is dependable.
Quality-checked inventory flows directly into your system of record—without new workflows or a rip-and-replace rollout.

See the system in action and explore what it could do for your jurisdiction. Our demos are always informative, never sales.
Public works · DOTs · Right-of-way agencies